
In 2017, we received funding from the Medieninnovationszentrum Babelsberg to develop SVIFT, a novel conversational UI, allowing non-experts to create data visualisations in only a few minutes.
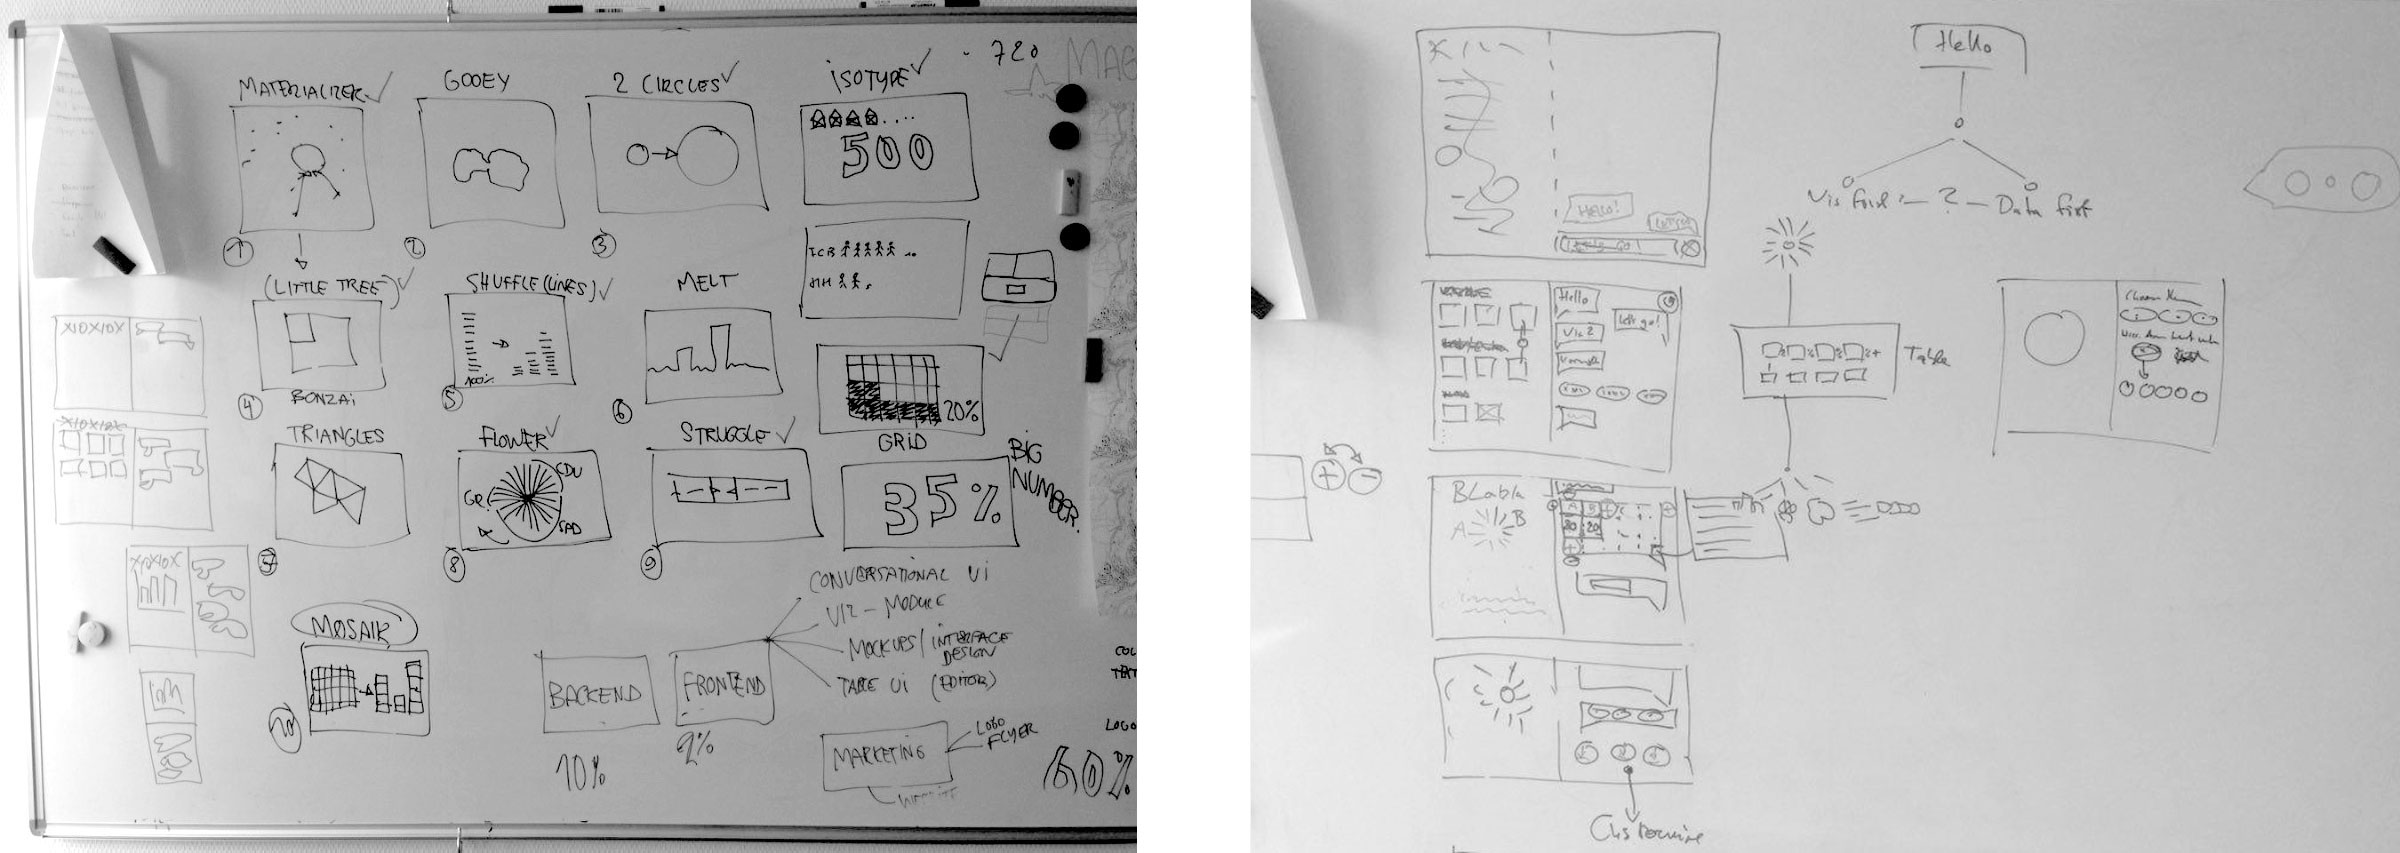
We travelled through the whole of Germany, meeting journalists in local and national news rooms, to learn more about what the everyday challenges of journalists deadling with data visualisation tasks look like. To learn more about our process, read our Medium article.
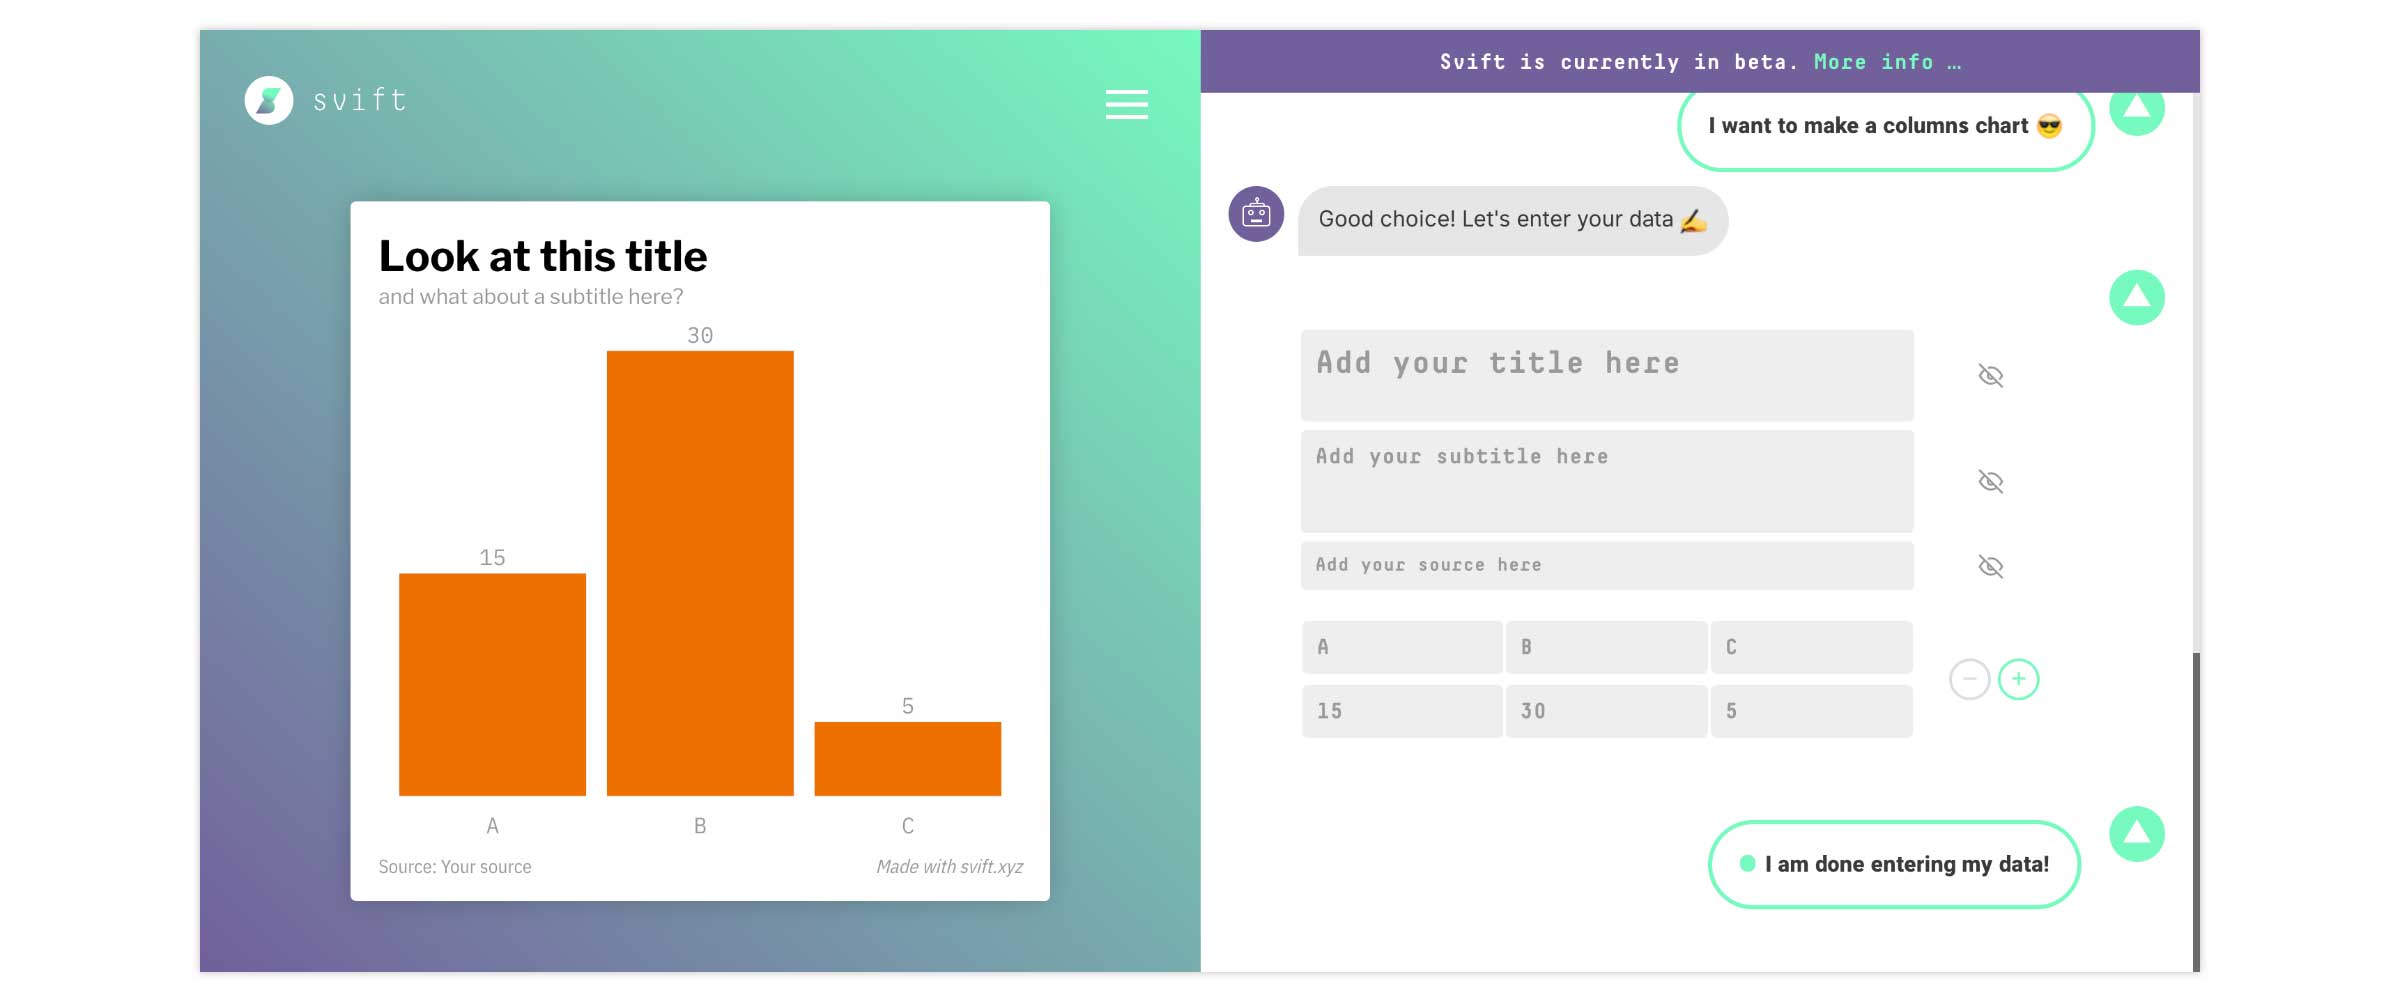
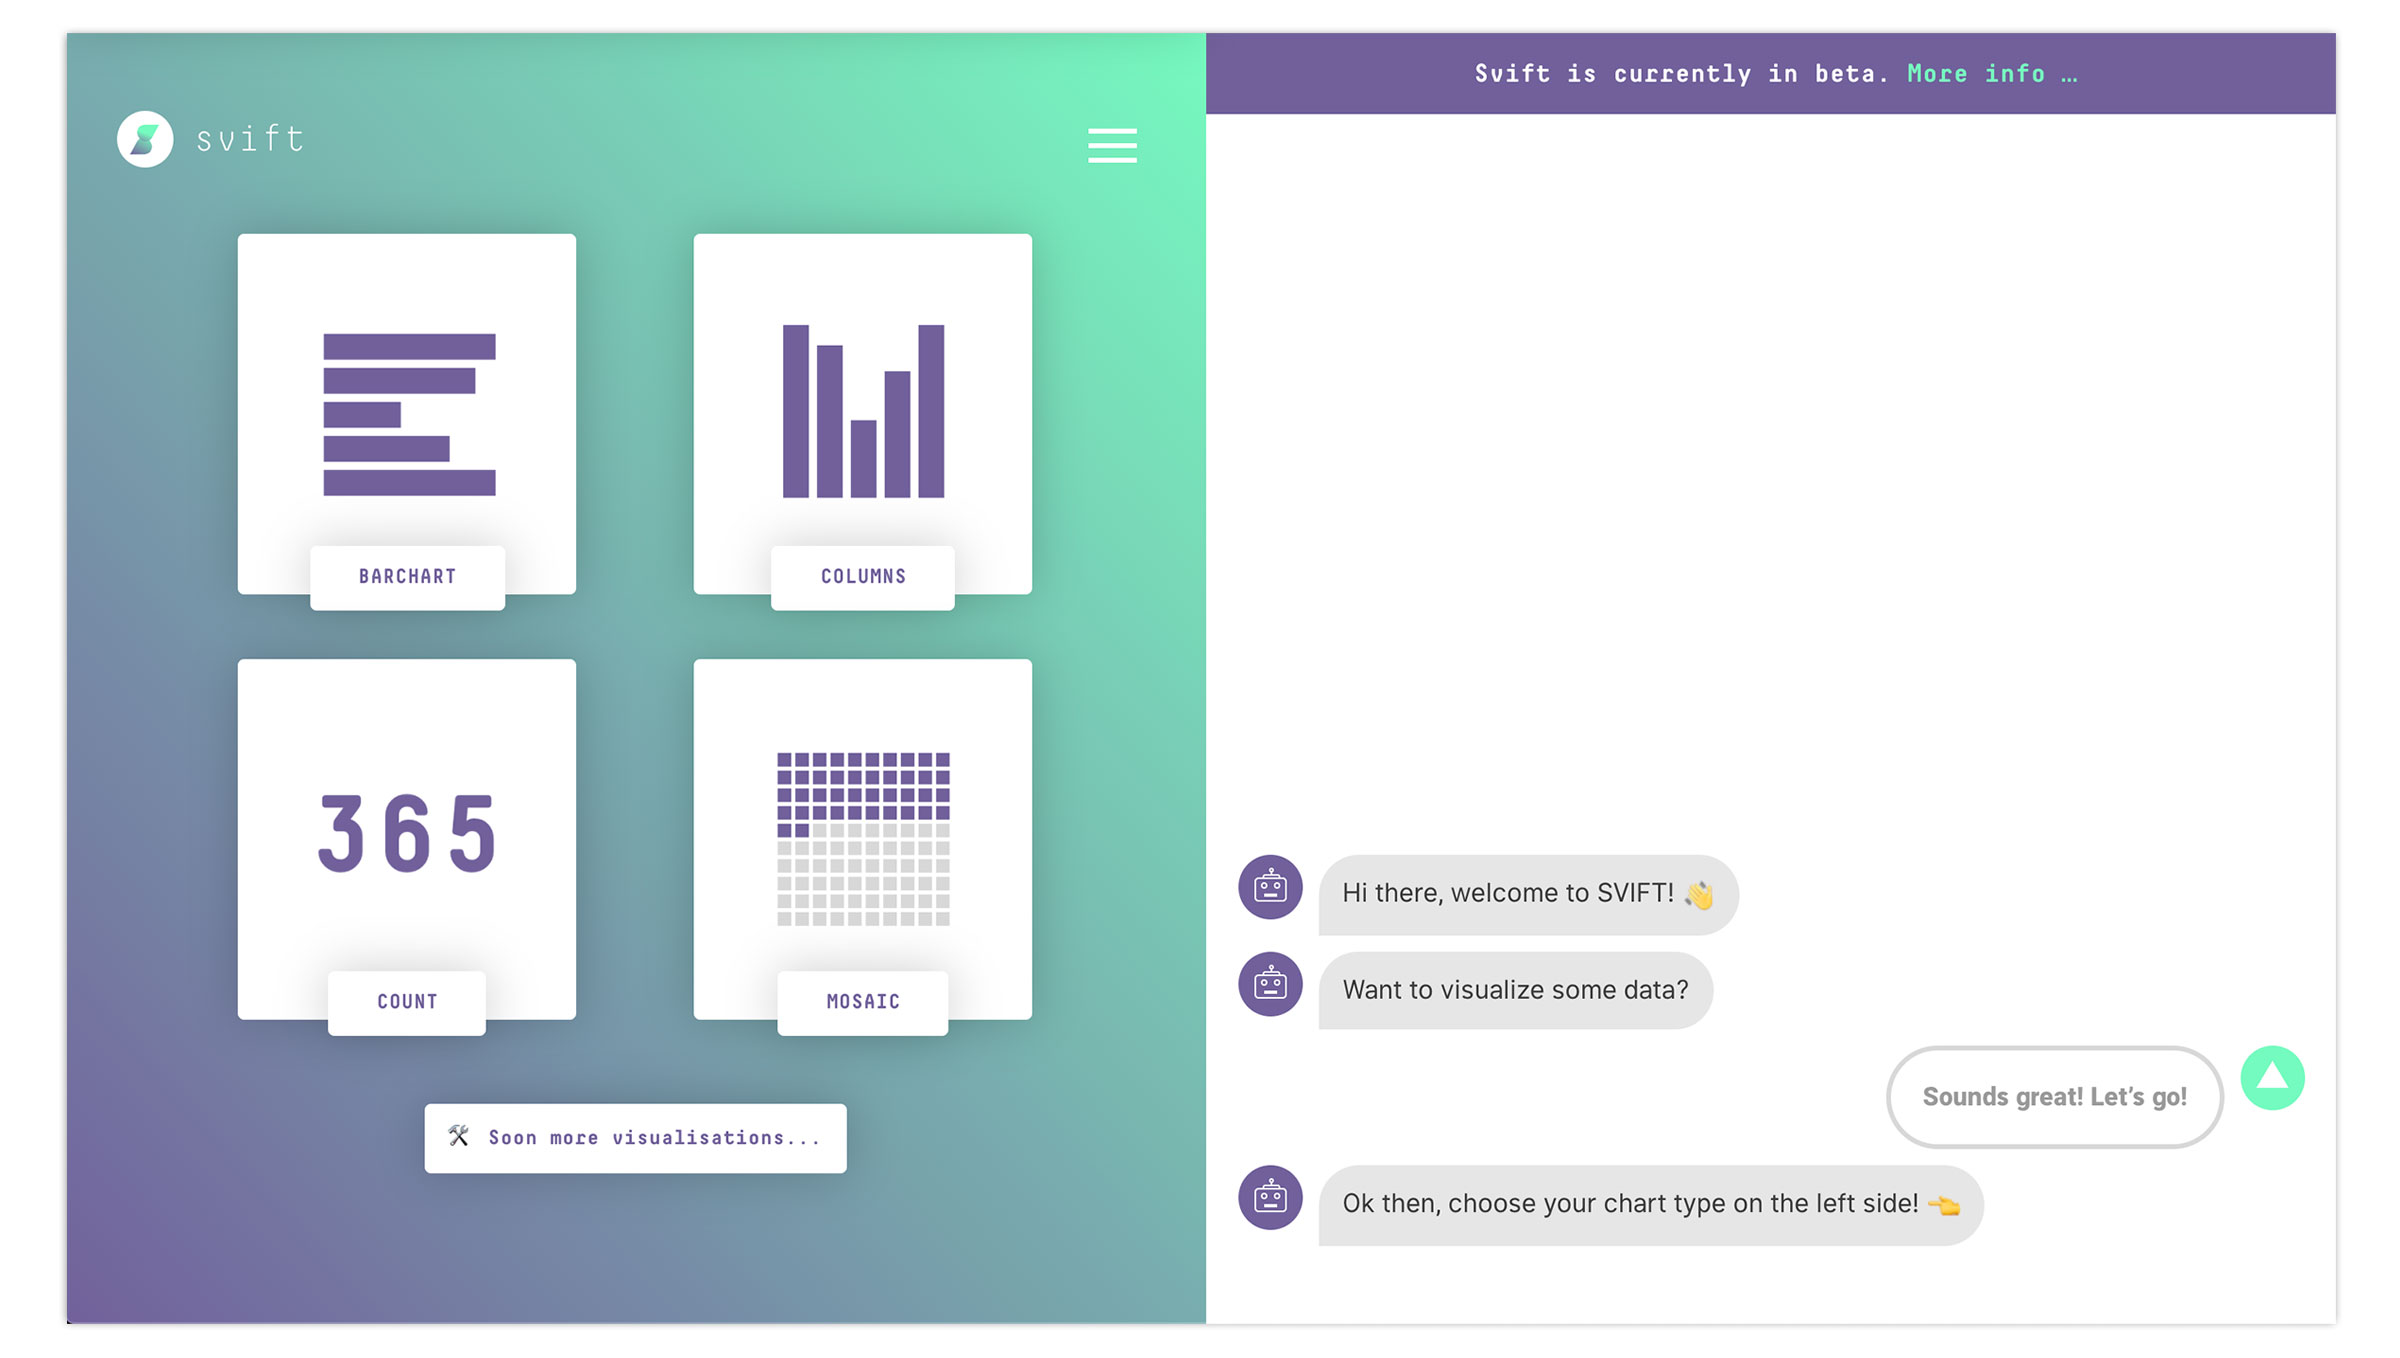
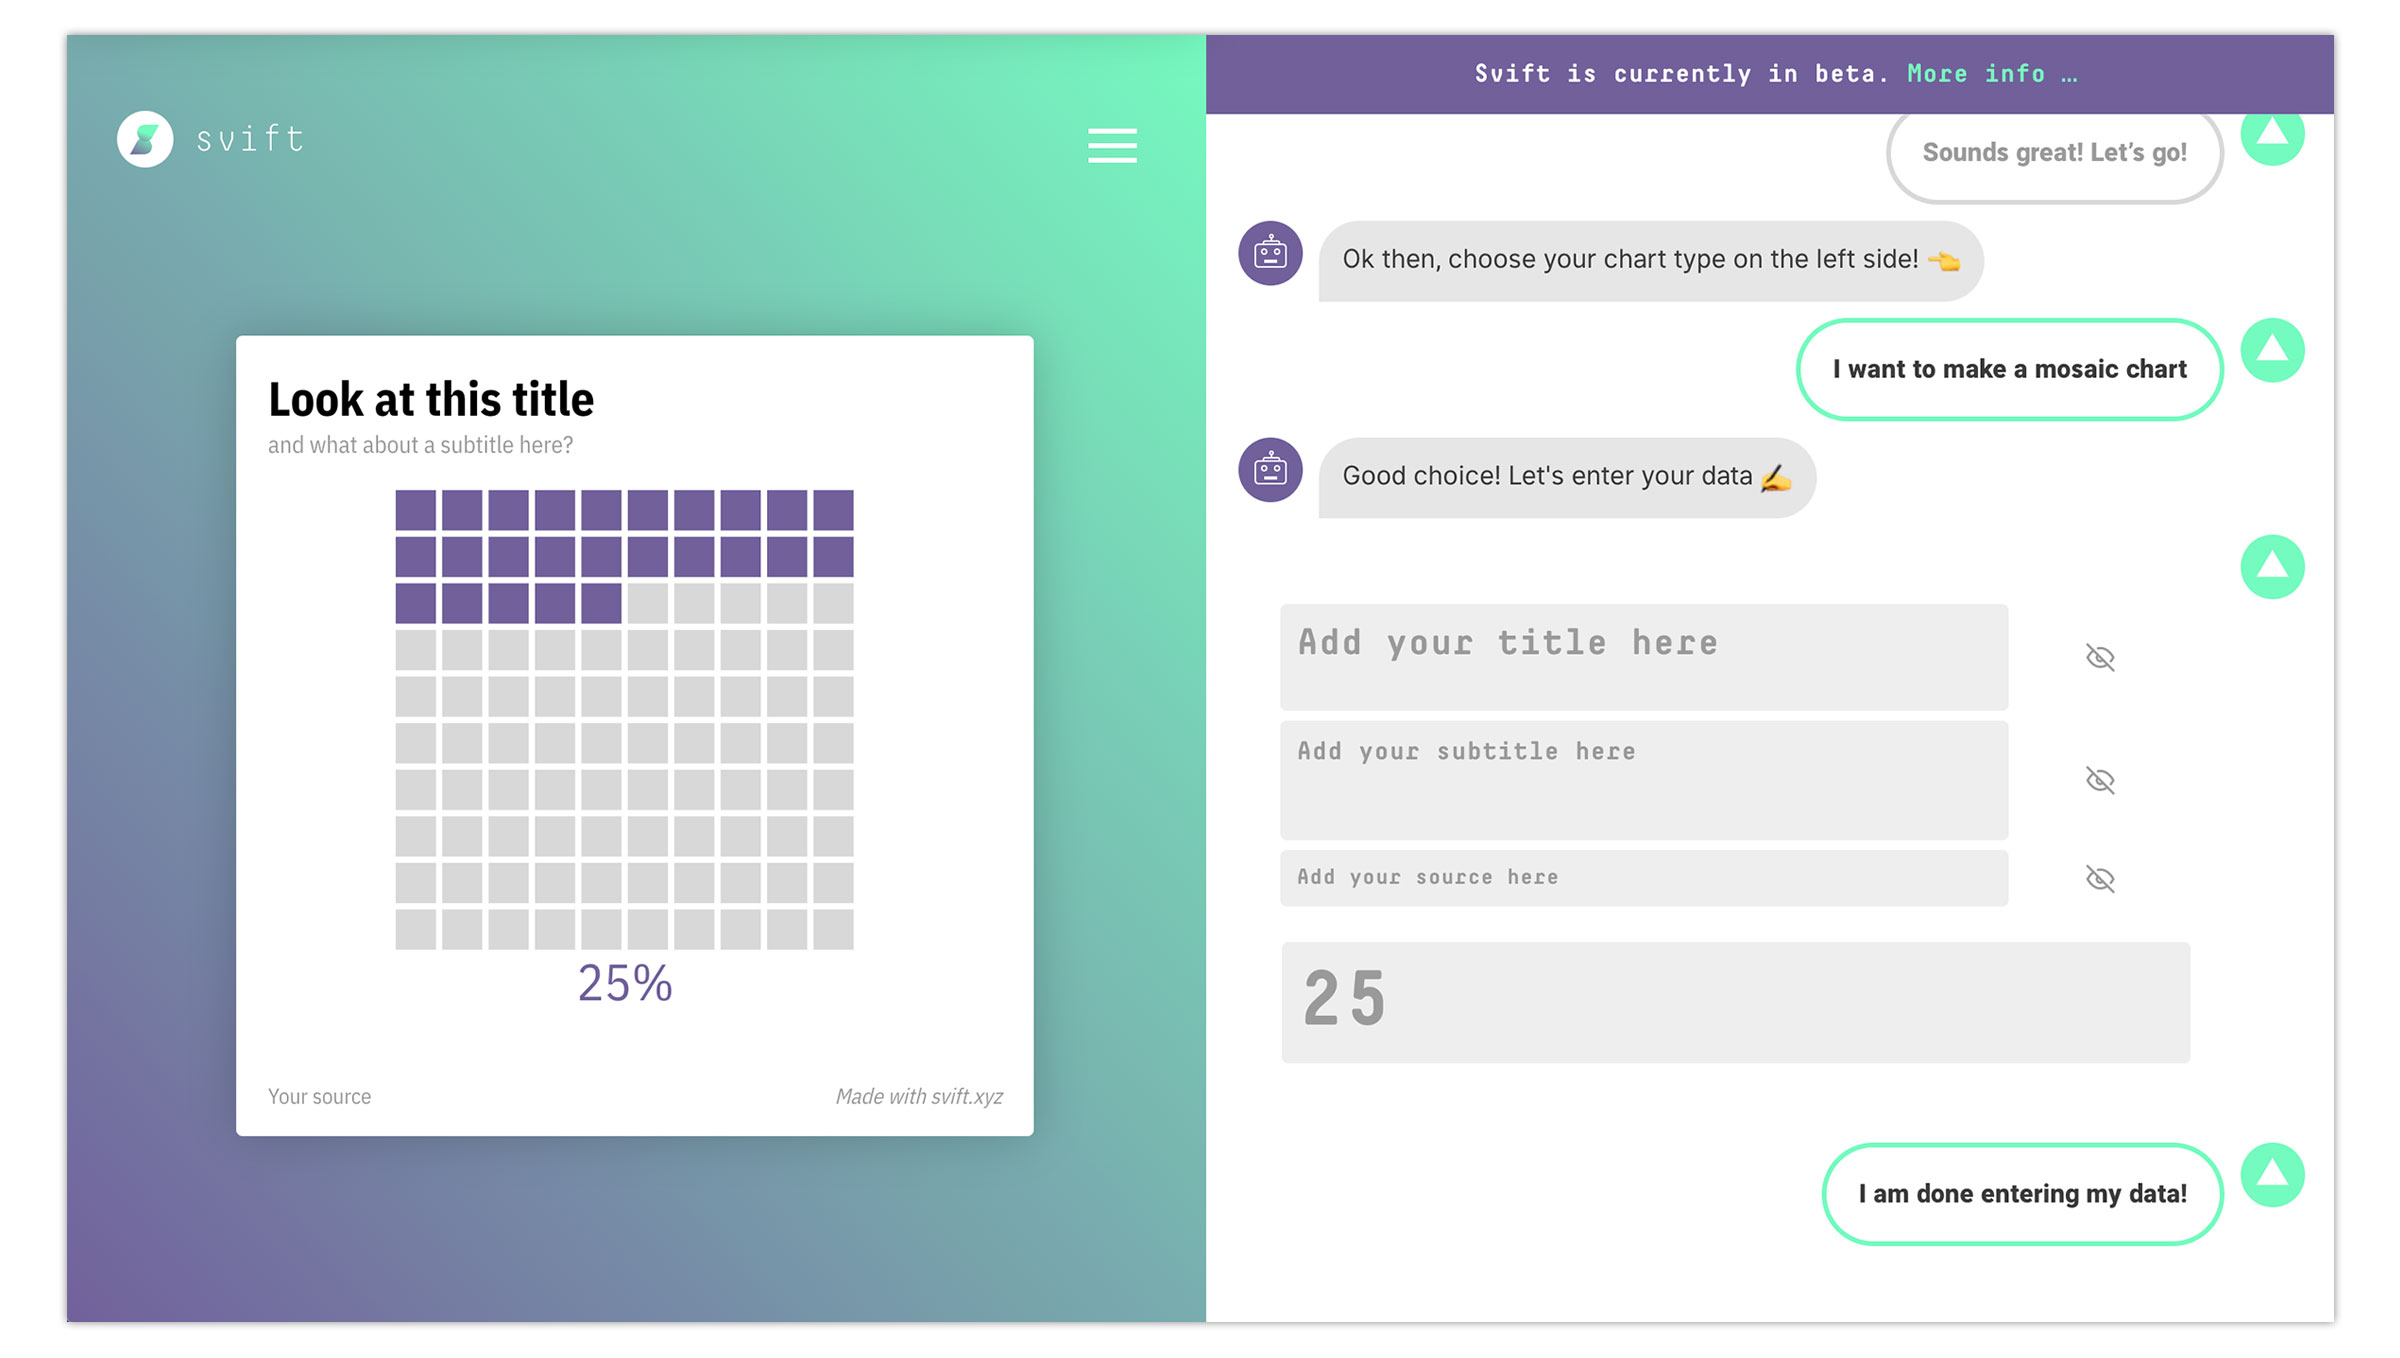
We developed a solution that is boiled down to the most essential functions, which the users really need in their everyday work. By reducing the complexity of the visualisation process, we are allowing users to create beatifully animated charts in just a few minutes. As the chat-bot guides the users through to process, no training is required.

VISLAB is transforming data and information into engaging interactive experiences: from data visualisations, to interactive exhibits, to information portals. Throughout our process: from ideation, to conception, to development, we are taking advantage of user-centered design and user research principles, trying to align innovative technological solutions with actual user needs. Beyond project conception and development, we are also consulting clients and organizing workshops on user-centered design and data visualization.
Sebastian Meier is the founder and lead of VISLAB. Sebastian has a background in Design, HCI and Data Visualisation. He teaches at HafenCity University Hamburg as a guest professsor, is one of the founders of Maptime Berlin and is heading the German Cartographic Society's commission for cartography and research.
Most of VISLAB's projects are collaborations with a network of research institutes, companies and experts across the domains of design, web-development, data science and visualisation.